Agilent Technologies B1500A User's Guide Page 42
- Page / 202
- Table of contents
- BOOKMARKS
- Agilent B1500A 1
- Safety Summary 6
- Safety Symbols 8
- &$7 9
- v¨O½v¶´ 11
- Product Stewardship 16
- Precautionary Statement 17
- Working in Comfort 18
- In This Manual 20
- Contents 21
- 1 Getting Started 25
- + agb1500a 27
- + UsbDevice1 27
- To Turn B1500A On 28
- To Turn B1500A Off 28
- To Launch EasyEXPERT 30
- If Only One Workspace Exists 31
- To Create Workspace 32
- To Select Workspace 33
- To Use Tracer Test Mode 34
- To Use Application Test Mode 36
- Test Definitions 37
- To Use Classic Test Mode 38
- To Perform Measurement 40
- To Use Test Result Editor 41
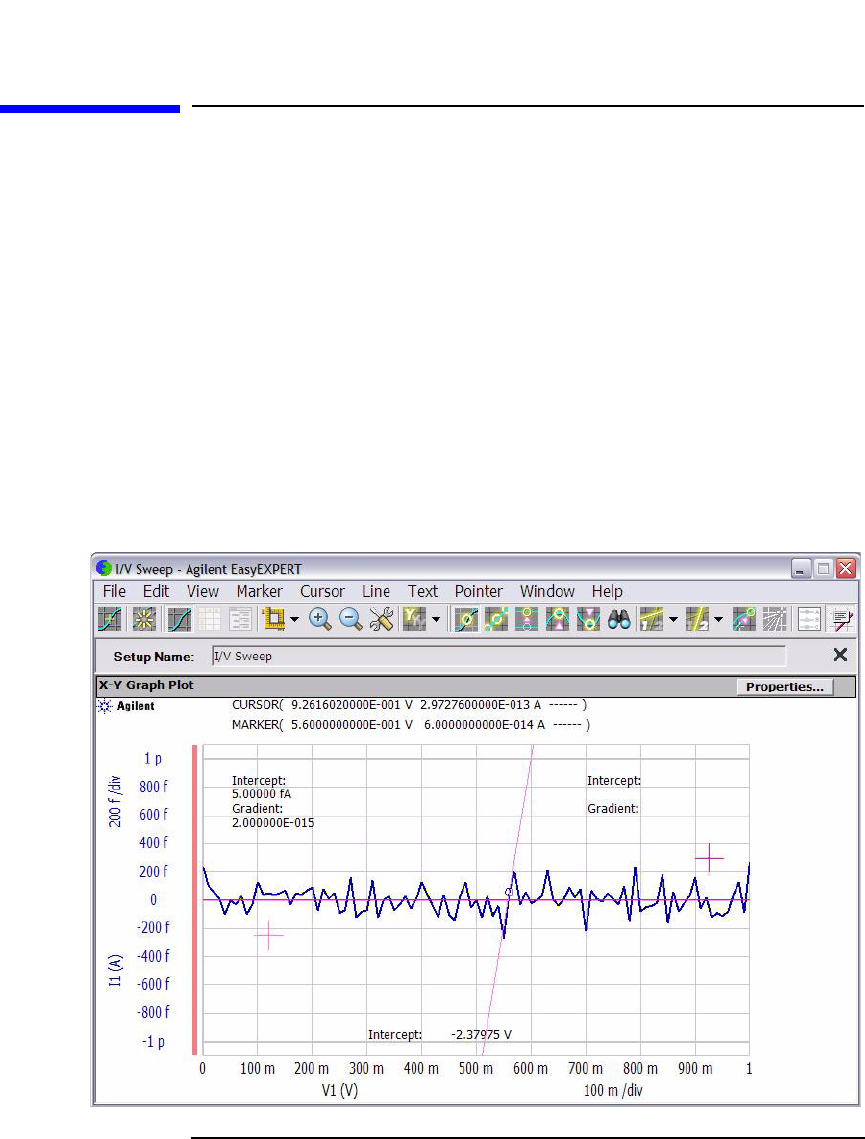
- To Use Analysis Tools 42
- 2 Introduction 43
- Application Library 44
- Overview 45
- Agilent EasyEXPERT Software 48
- Front View 50
- Rear View 53
- GNDU - Ground Unit 59
- *1'8 59
- &RPPRQ 59
- About SMU 60
- HPSMU - High Power SMU 61
- MPSMU - Medium Power SMU 64
- To connect ASU 67
- Before using 1 pA range 67
- MCSMU - Medium Current SMU 68
- HRSMU - High Resolution SMU 70
- MFCMU - Multi Frequency CMU 74
- 300 k7 range 76
- 50 7 range 76
- HVSPGU - High Voltage SPGU 77
- 3 Installation 79
- Power Requirements 82
- Operating Environment 82
- Installation Requirements 83
- Power Cable 83
- Requirements 84
- Inspection and Installation 85
- To Perform Initial Setup 86
- To Change GPIB Address 88
- To Enable System Controller 89
- Installing Accessories 90
- To Set up 16442B (B1500A-A5F) 91
- To Connect Connector Plate 93
- To Connect ASU 95
- About ASU output cables 97
- To Connect SCUU/GSWU 99
- 6&88 100
- About SCUU output cables 101
- To Connect GNDU Adapter 103
- Selection switch SW2 and SW4 105
- Input Panel 106
- Output Panel 106
- Mounting Connectors 107
- 108
- ï ï0[ 108
- To Make an Interlock Circuit 109
- Connector side 109
- Interlock switch 109
- Wiring side 109
- Installation 111
- To Connect GNDU Output 112
- To Connect SMU Output 113
- To Minimize Leakage Current 114
- To Connect MCSMU Output 119
- To Connect MFCMU Output 120
- Stop key 121
- Using Test Fixture 122
- 6089 $0D[ 123
- 'UDLQ 123
- 6XEVWUDWH 123
- Using Connector Plate 124
- To Reduce Leakage Current 124
- '87 125
- To Measure Low Resistance 126
- Switching Matrix 128
- Required Conditions 129
- )25&(RU6(16($ 134
- )25&(RU6(16(% 134
- ,QVXODWRU 134
- 7ULD[LDO&DEOH 134
- Cleaning 136
- Self-test and Diagnostics 136
- Calibration 136
- Module Type and Locations 137
- To Interconnect SPGUs 138
- To Interconnect WGFMUs 139
- About Module Installation 140
- 4 Specifications 141
- Hardware 143
- Specification Conditions 143
- Supported Plug-in Modules 144
- Maximum Module Configuration 146
- Ground Unit (GNDU) 147
- MPSMU/HRSMU 148
- Specifications 149
- Connect ASU to dedicated SMU 151
- Connection path control 151
- SMU Common Specifications 157
- ± 1 mV (HPSMU) 161
- SCUU/GSWU 167
- : < 100 V at 300 sec 168
- Point Time Voltage 173
- Selector 174
- Selector Adapter 174
- WGFMU/RSU 175
- EasyEXPERT Software 182
- Operation mode 182
- Application library 182
- Oscilloscope view 183
- Measurement modes 184
- Sweep measurement 184
- Data display 186
- Automatic analysis function 187
- Arithmetic functions 187
- Workspace and data management 188
- External instrument control 188
- Furnished Software 189
- Desktop EasyEXPERT Software 190
- General Specifications 191
- 5 Accessories and Options 193
Related products and manuals for Measuring, testing & control Agilent Technologies B1500A
 (364 pages)
 (18 pages)
© 2020, manymanuals.com. All rights reserved. | 2.994 s |
 Manymanuals.com
 Manymanuals.de
 Manymanuals.fr
 Manymanuals.it
 Manymanuals.pl
 Manymanuals.cz
 Manymanuals.es
 Manymanuals-pt.com
Comments to this Manuals